Trace correlation
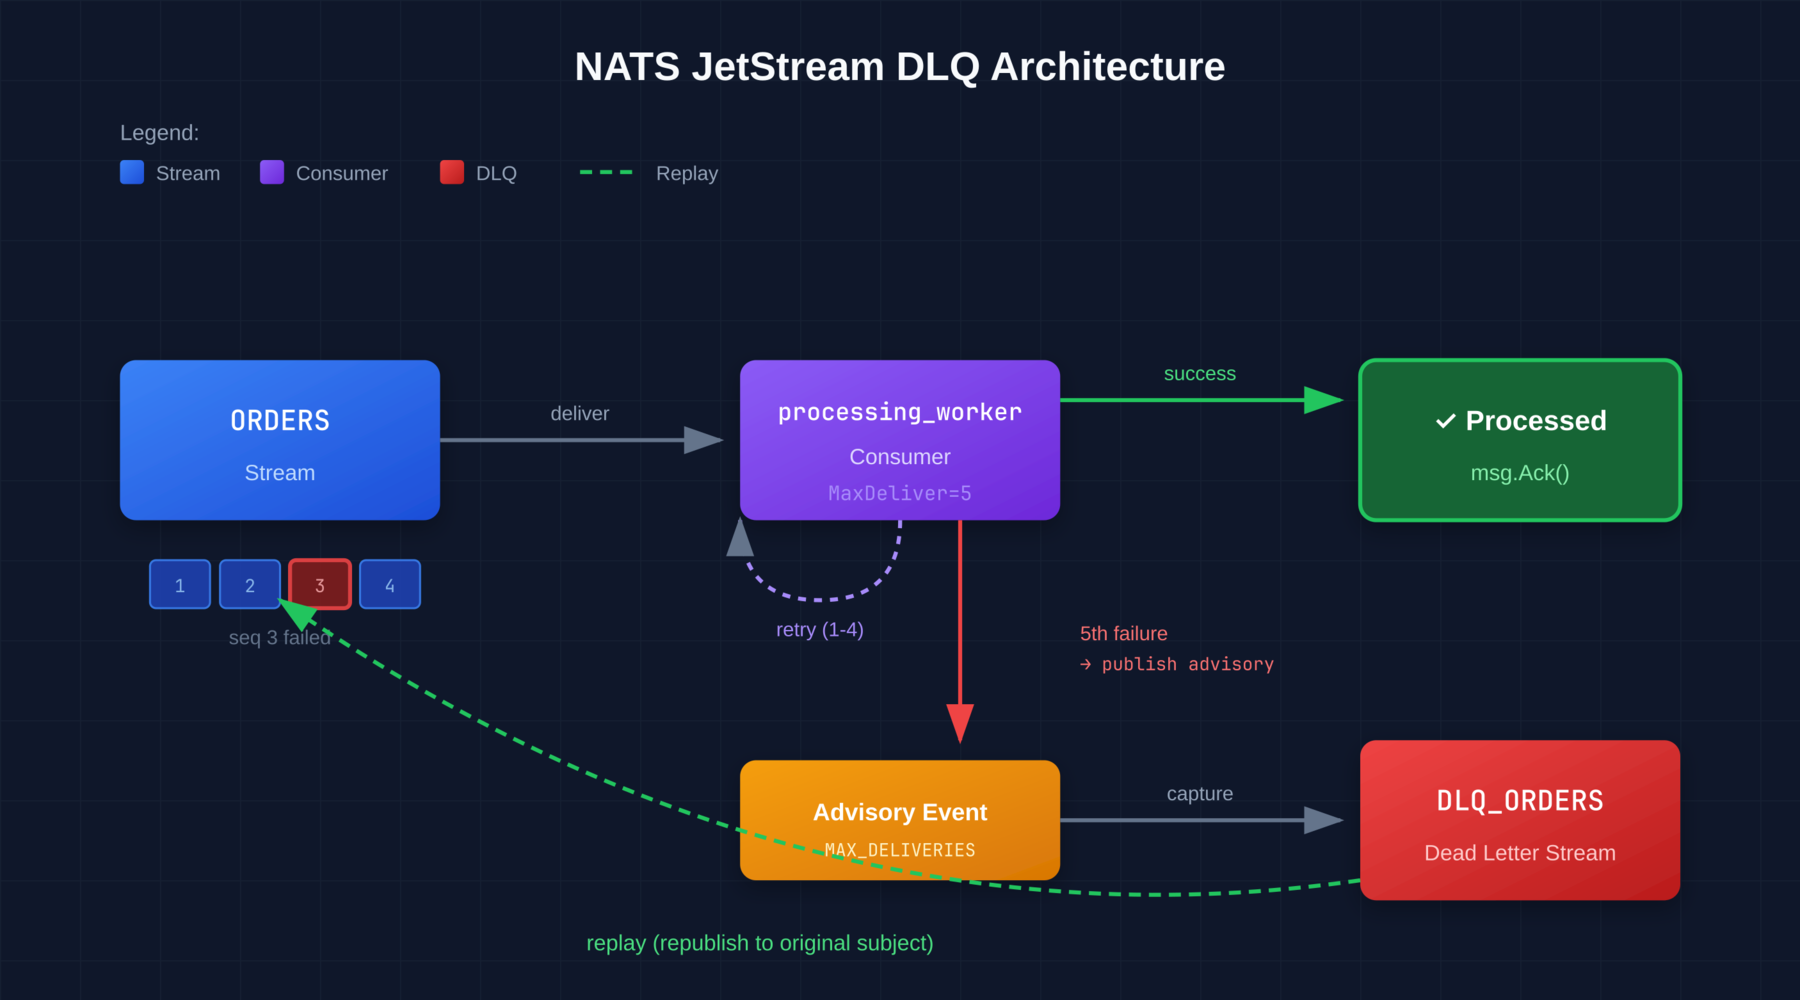
Publishers attach and propagate one stable trace-ID header. Consumer SampleFrequency enables sampled ACK and latency details.
Monitor streams and consumers, diagnose consumer lag, investigate failed deliveries, search messages, and trace flows across services—all from a self-hosted UI.
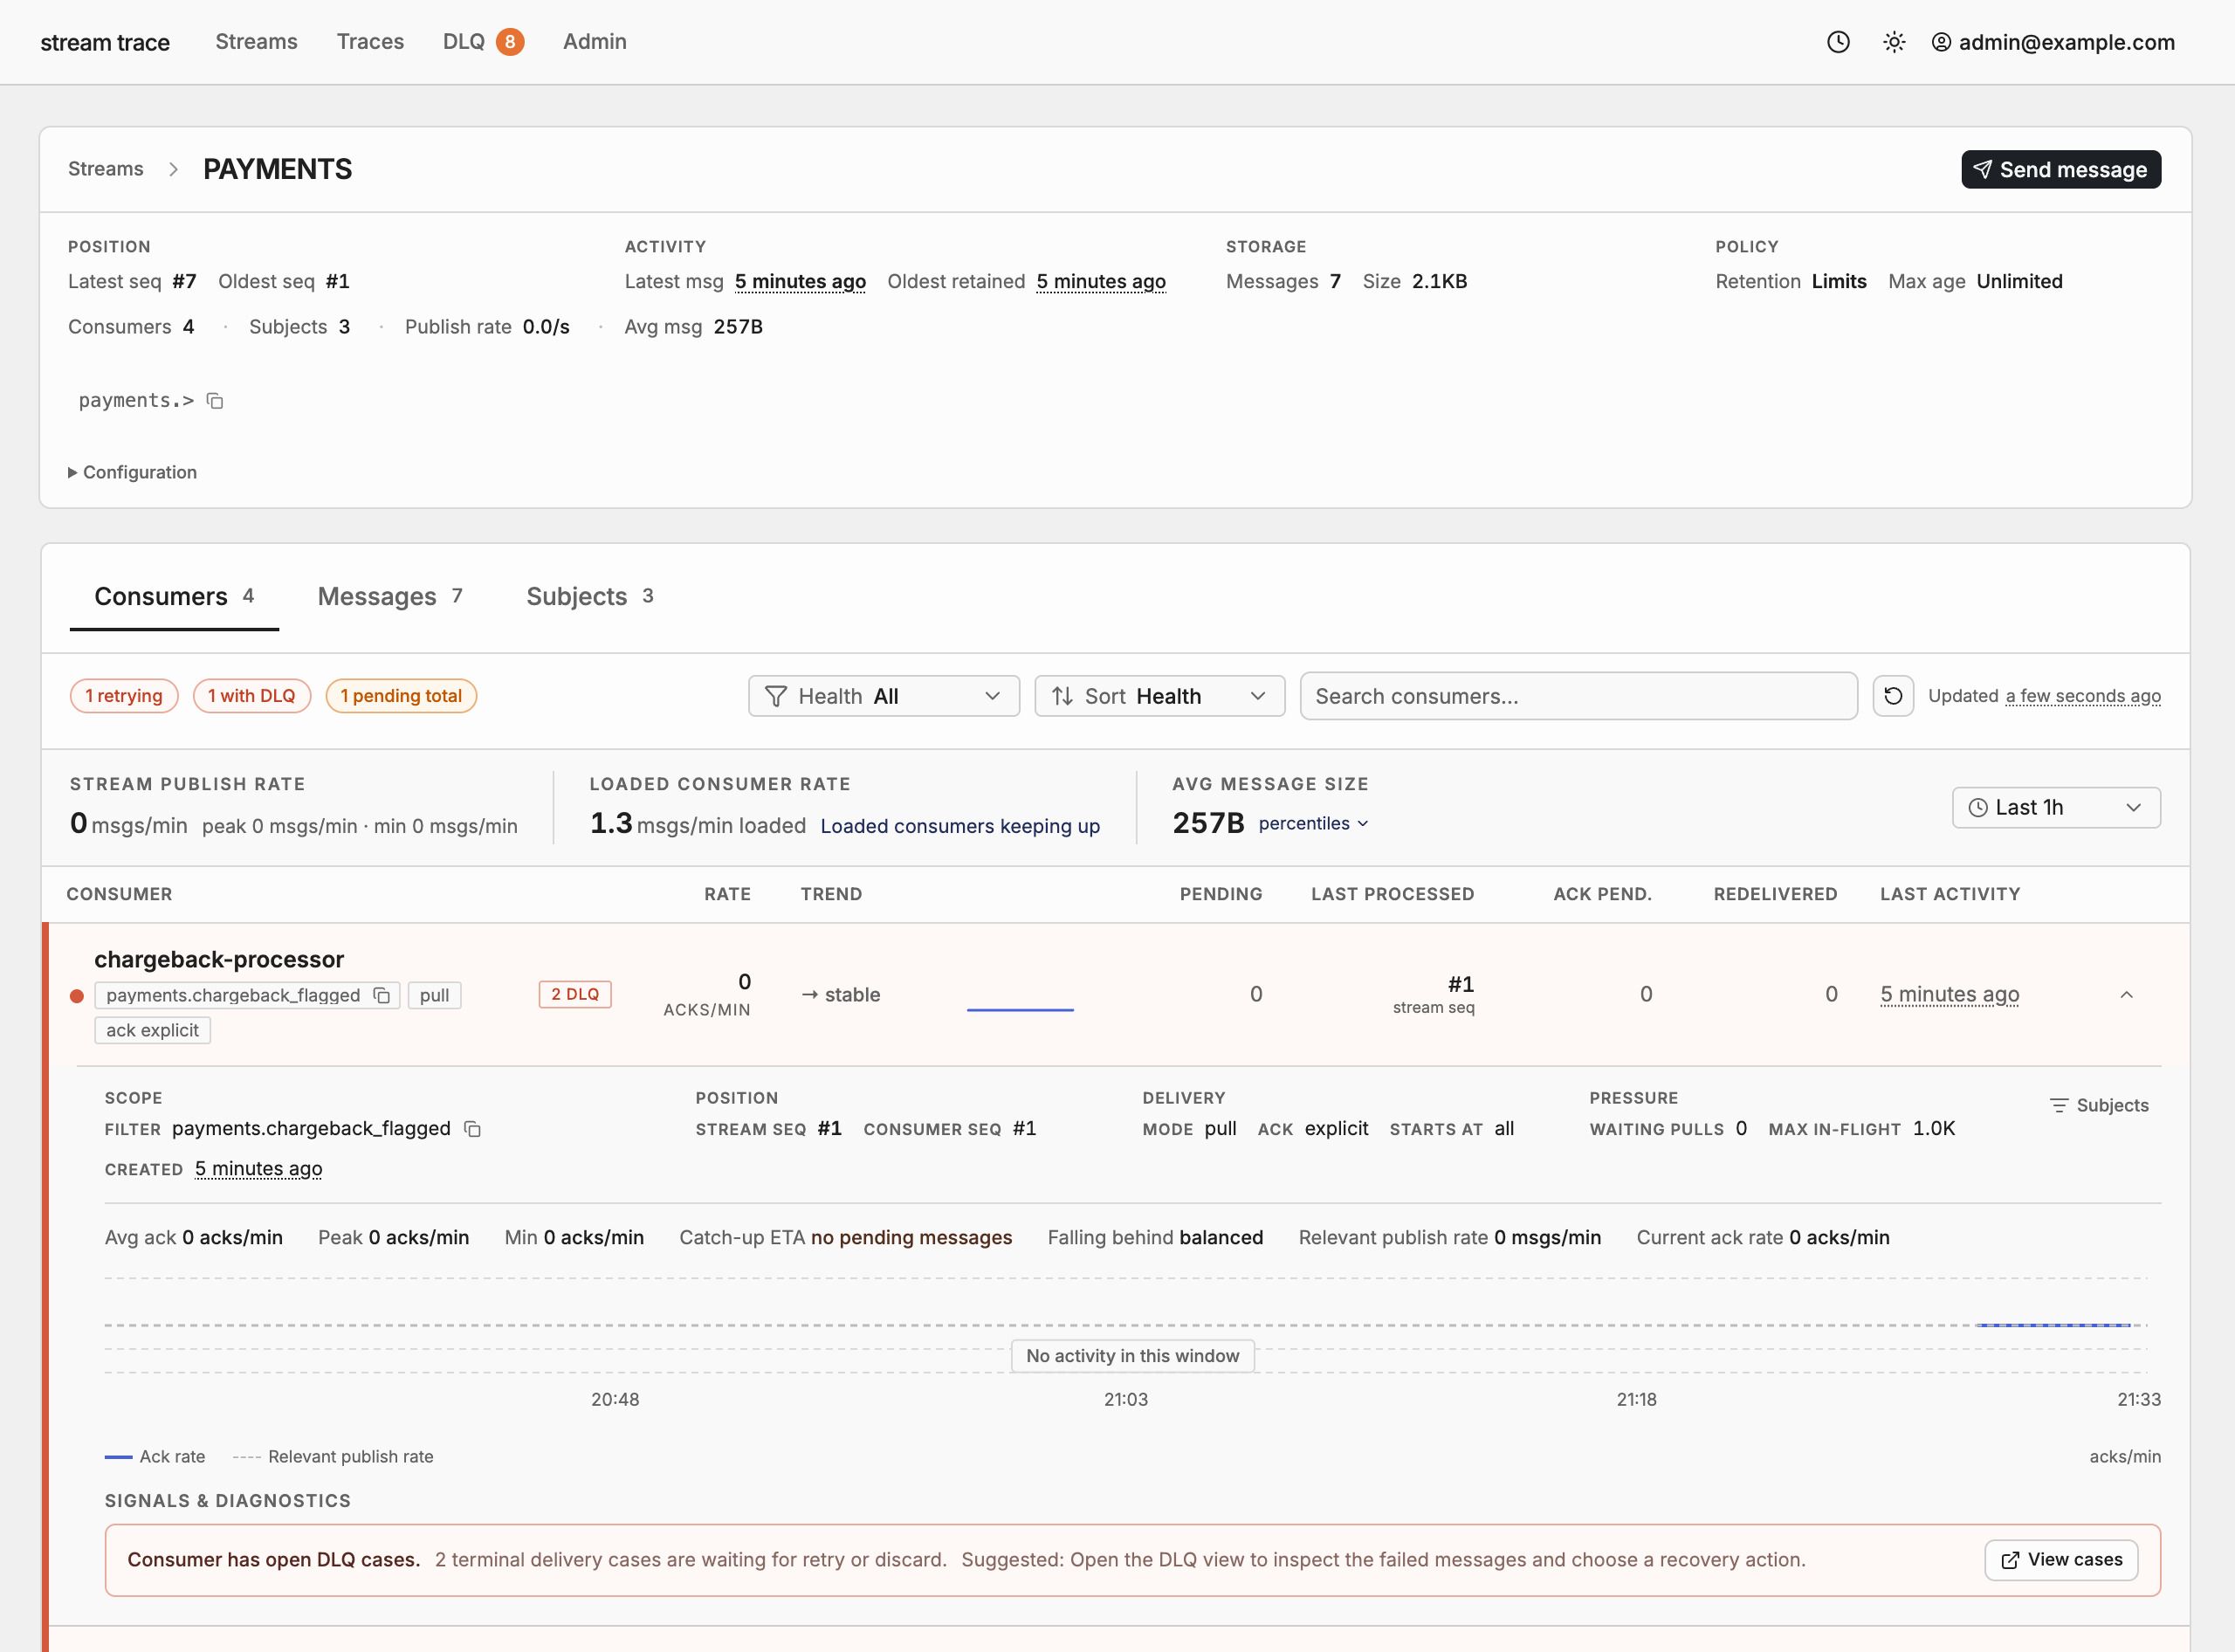
Investigating consumer lag, failed deliveries, and cross-service message flows takes too many manual steps. Stream Trace brings the evidence and debugging actions into one UI.
Grepping logs and stitching together CLI output before you can explain a failure
Stream, consumer, subject, and payload context lives in different commands and tools
Max-delivery and terminated-message advisories are easy to miss without dedicated capture
Following a known trace ID across streams and consumers takes manual investigation
Move from stream health to message-level evidence without losing the filters, ownership boundaries, and operational context around the problem.
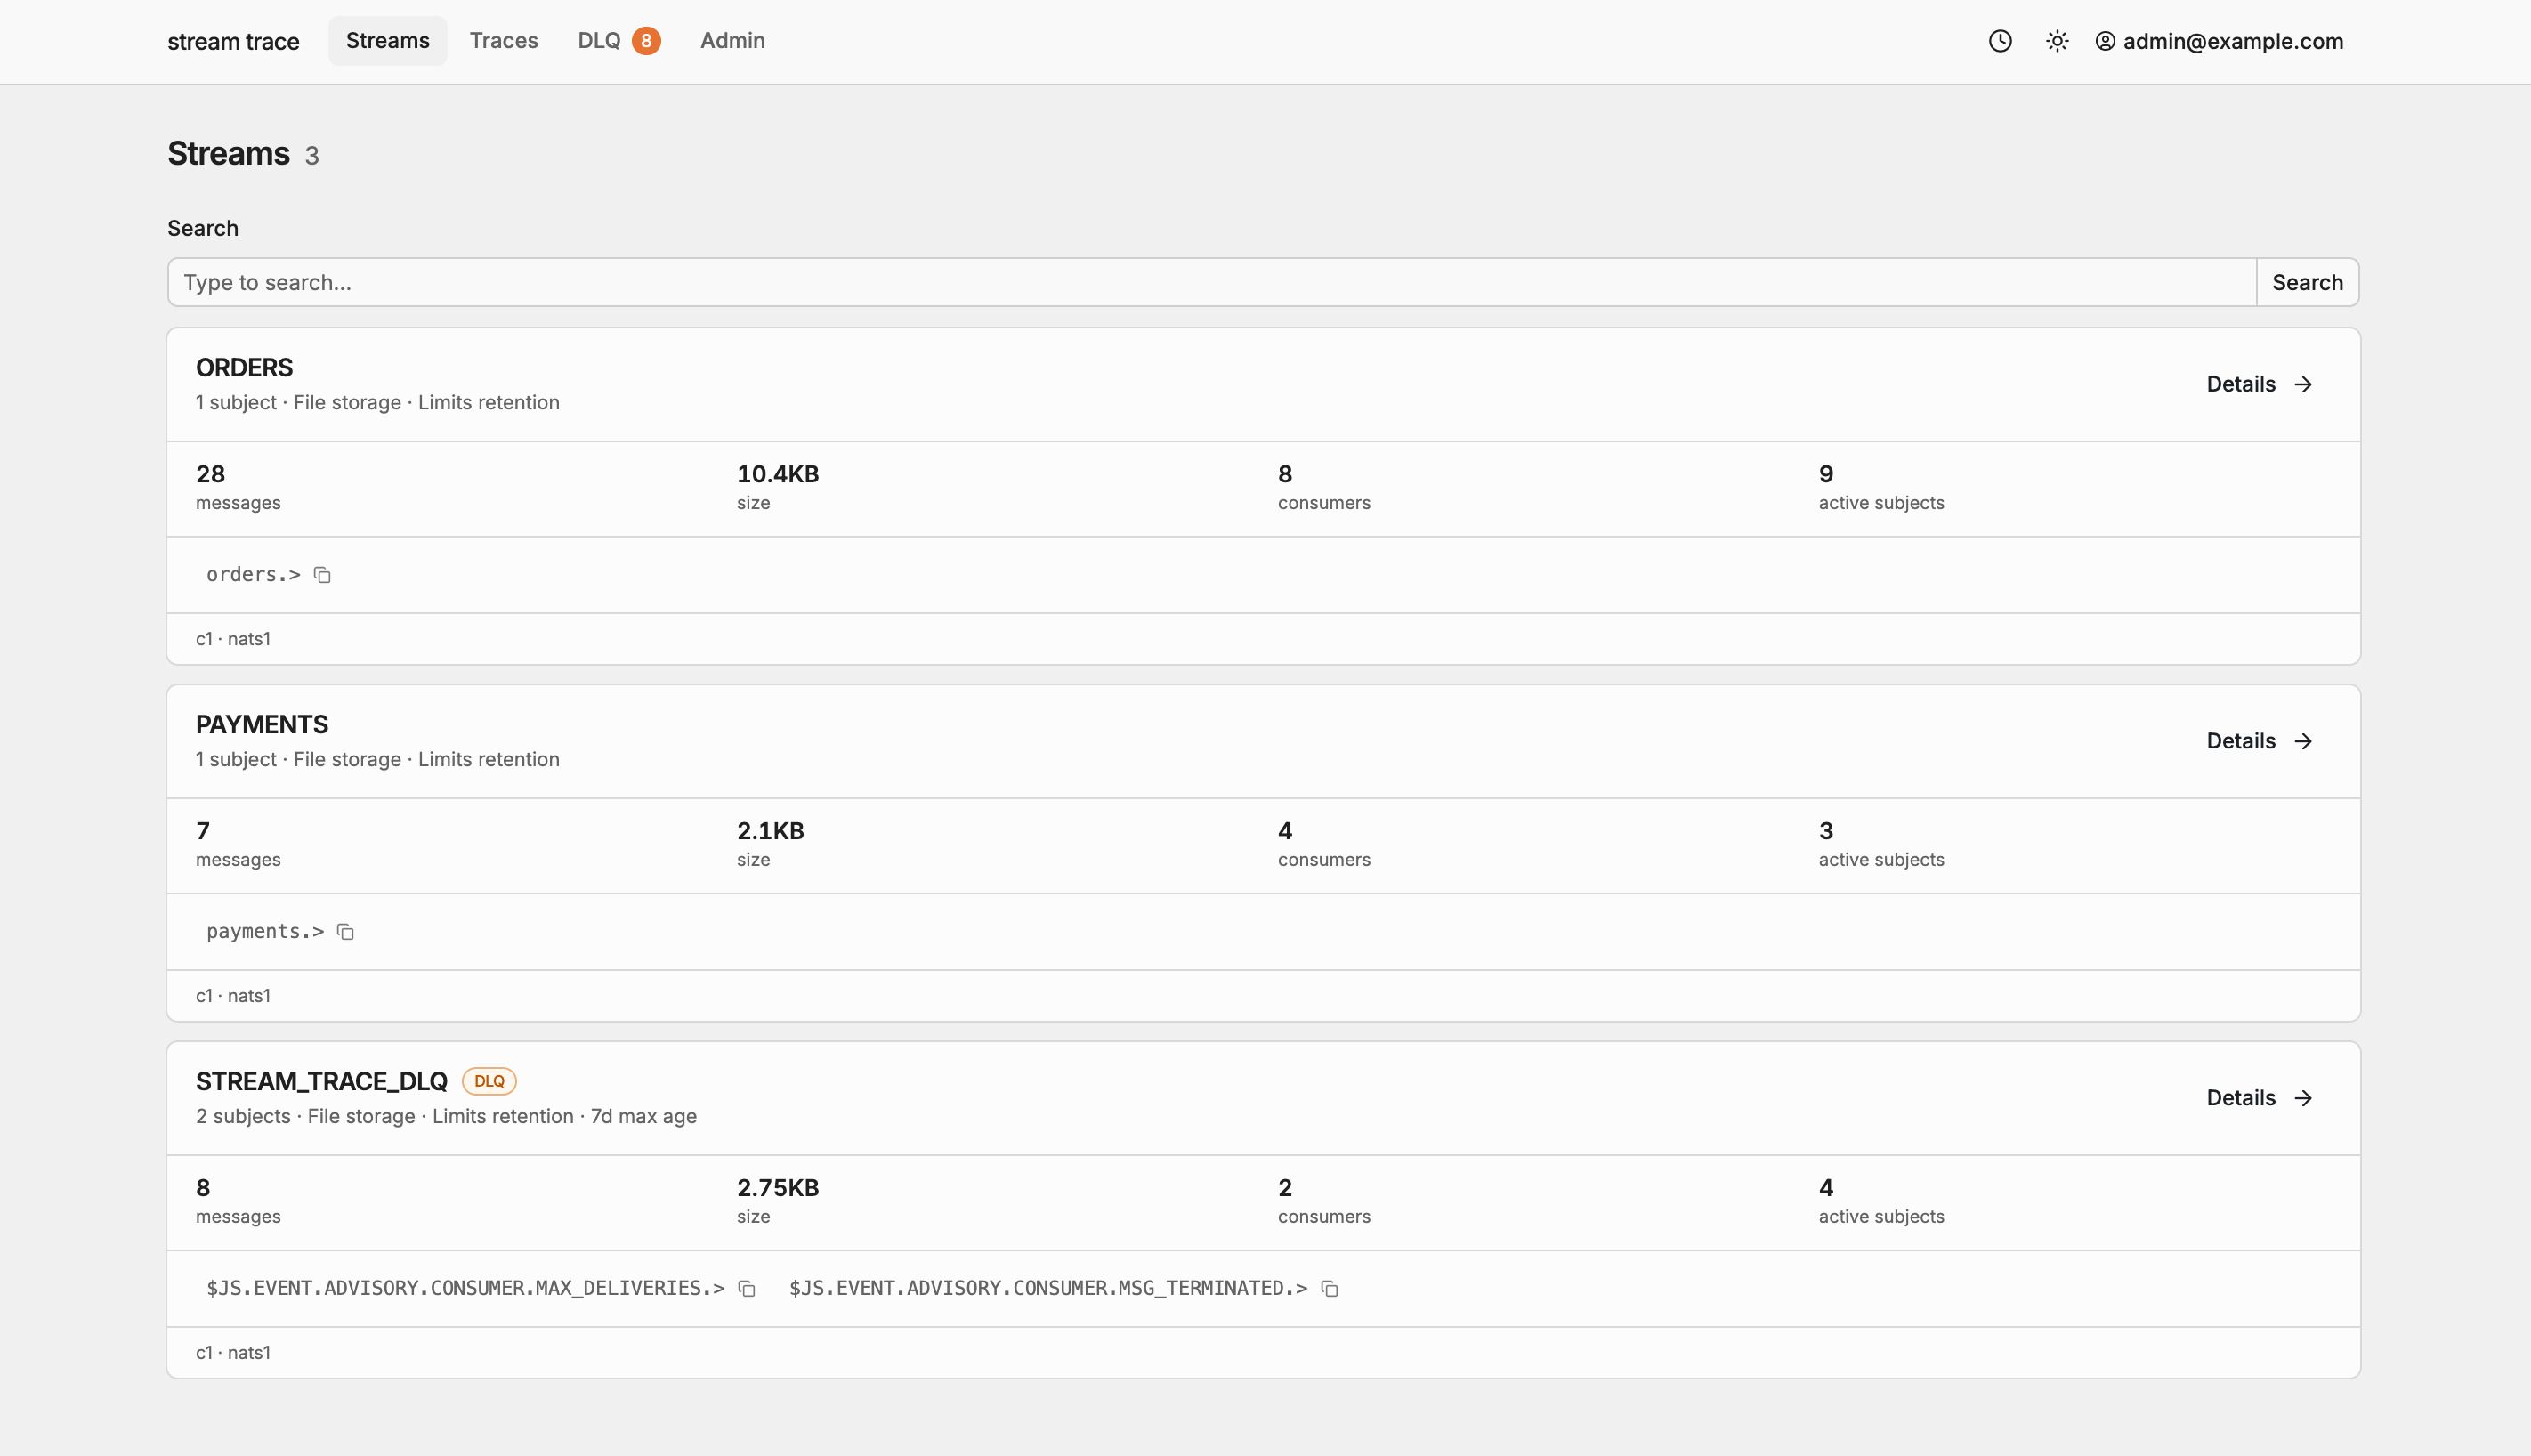
Inspect the JetStream streams and consumers you can access through auto-refreshing views and operational signals.
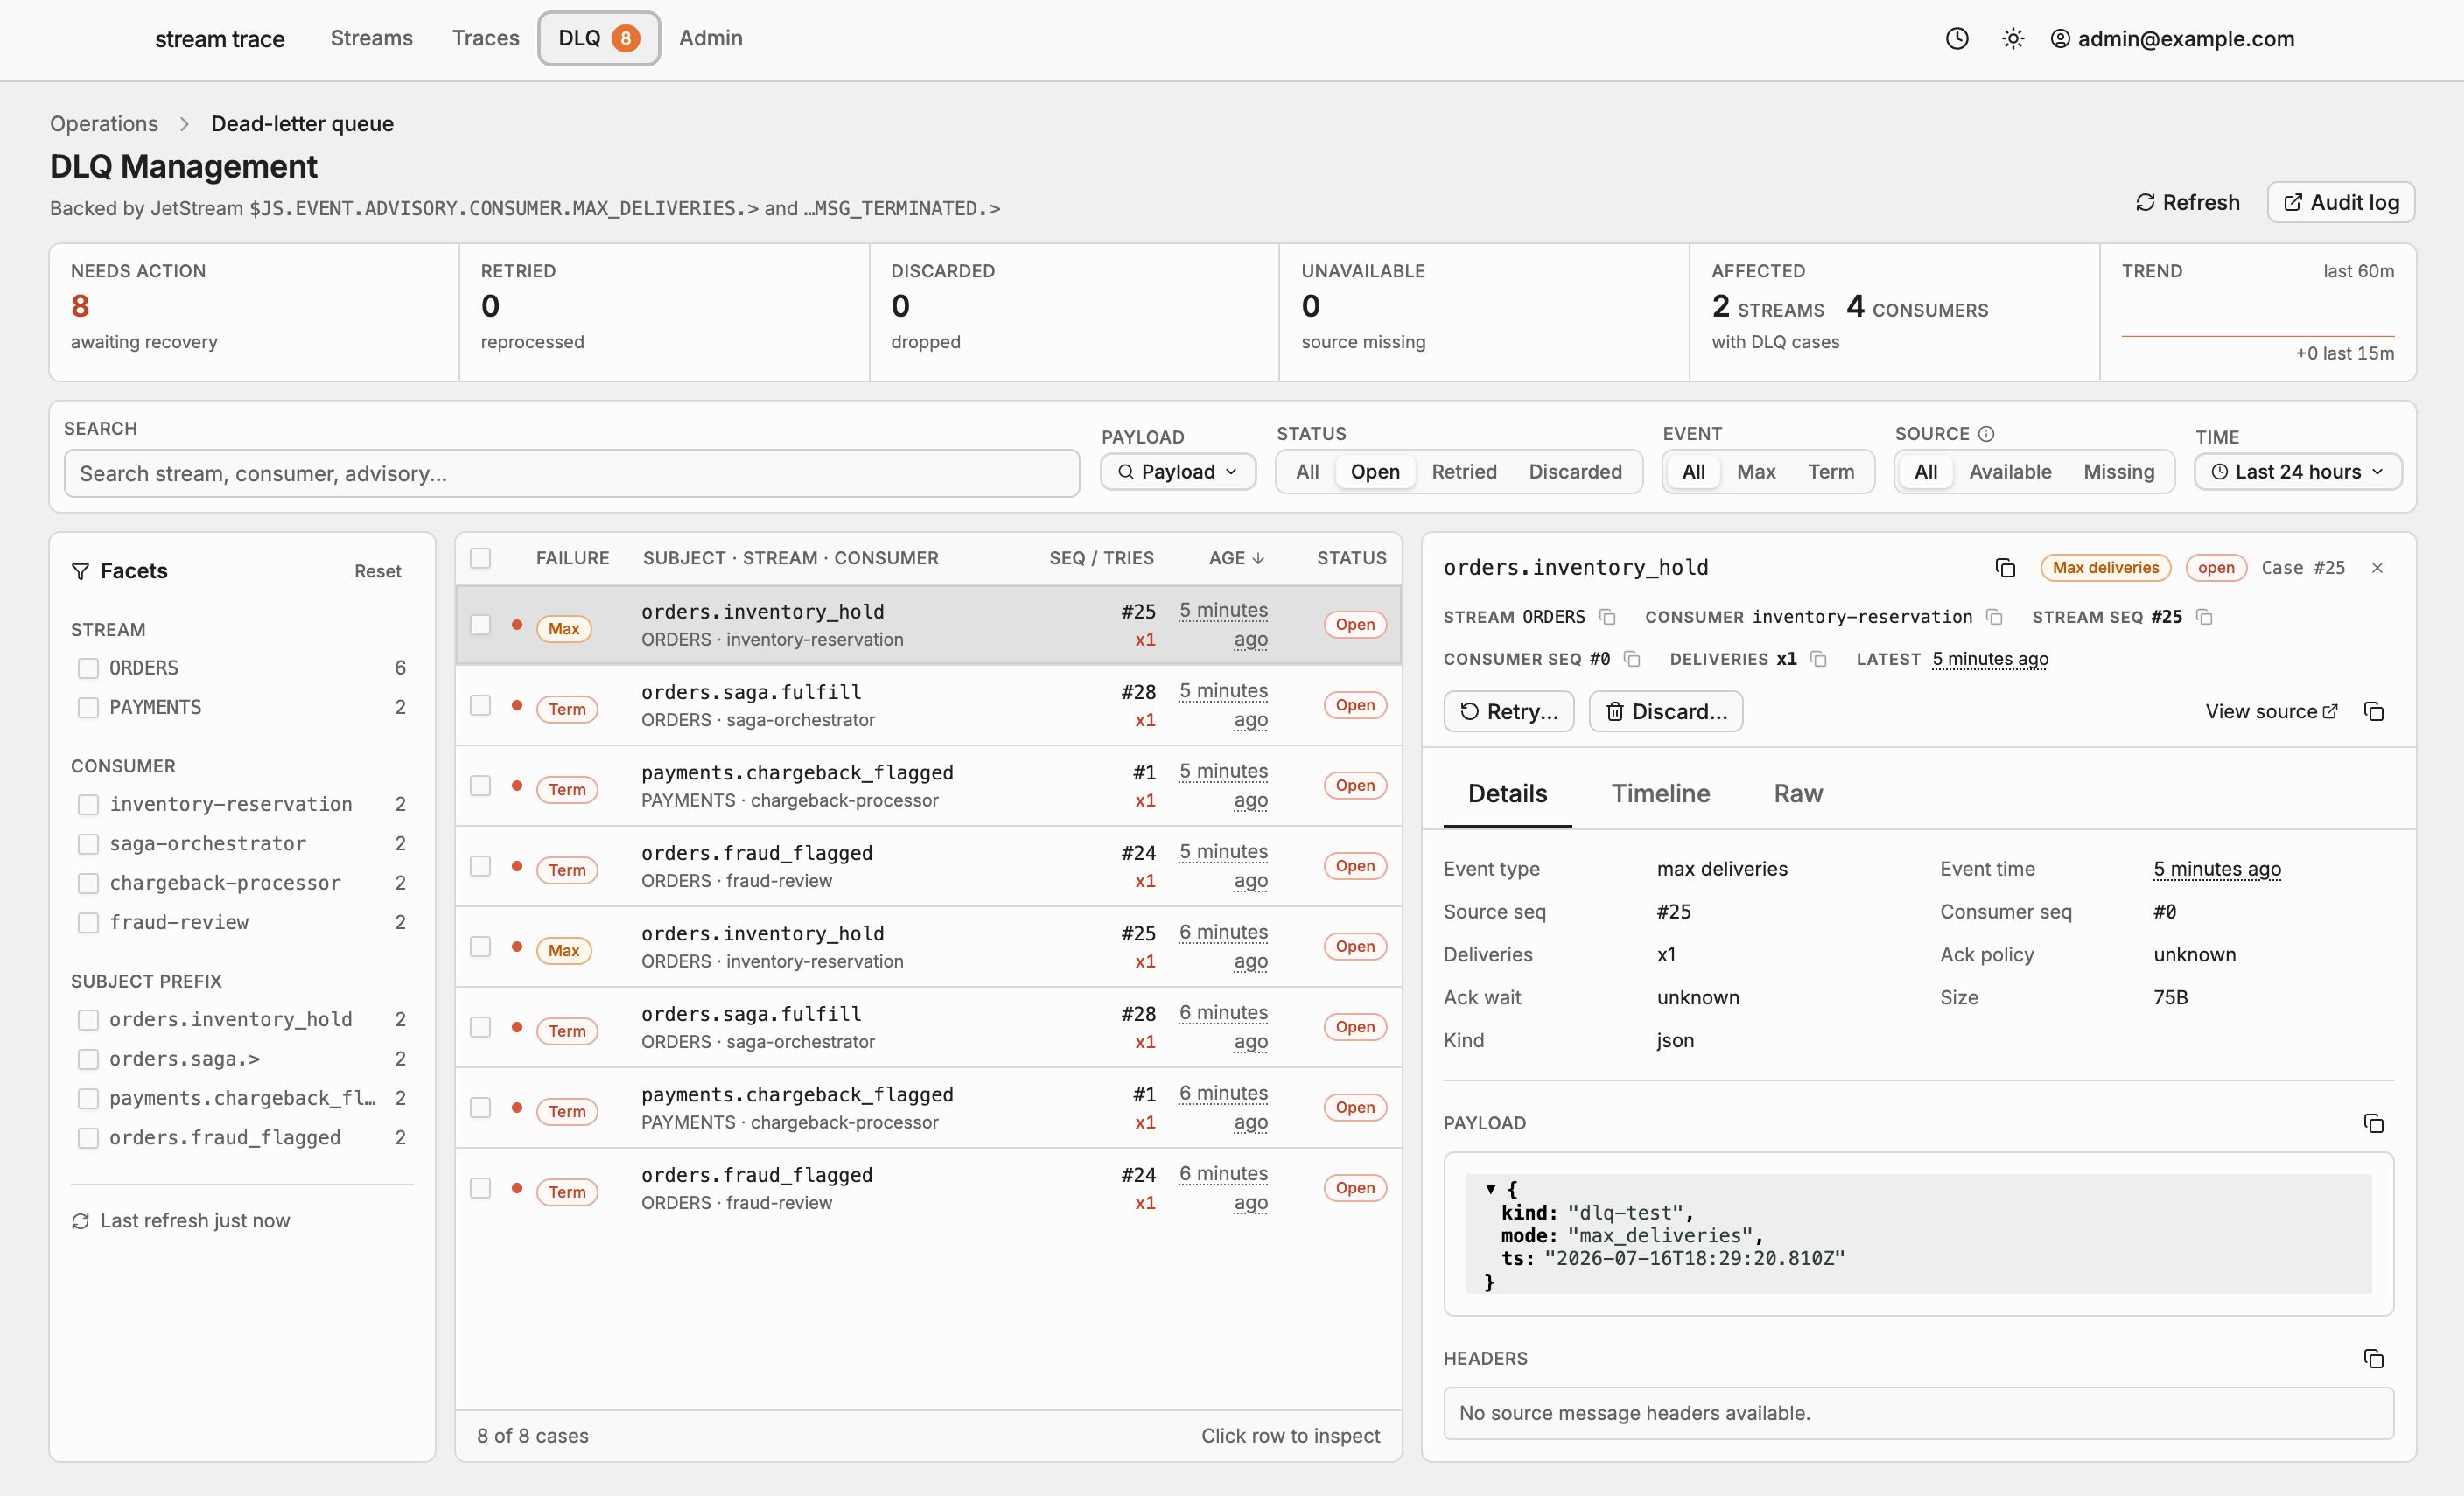
Turn terminal JetStream advisories into cases your team can inspect, retry, or resolve.
Spot struggling consumers with lag tracking, health signals, and throughput analytics that explain what changed.
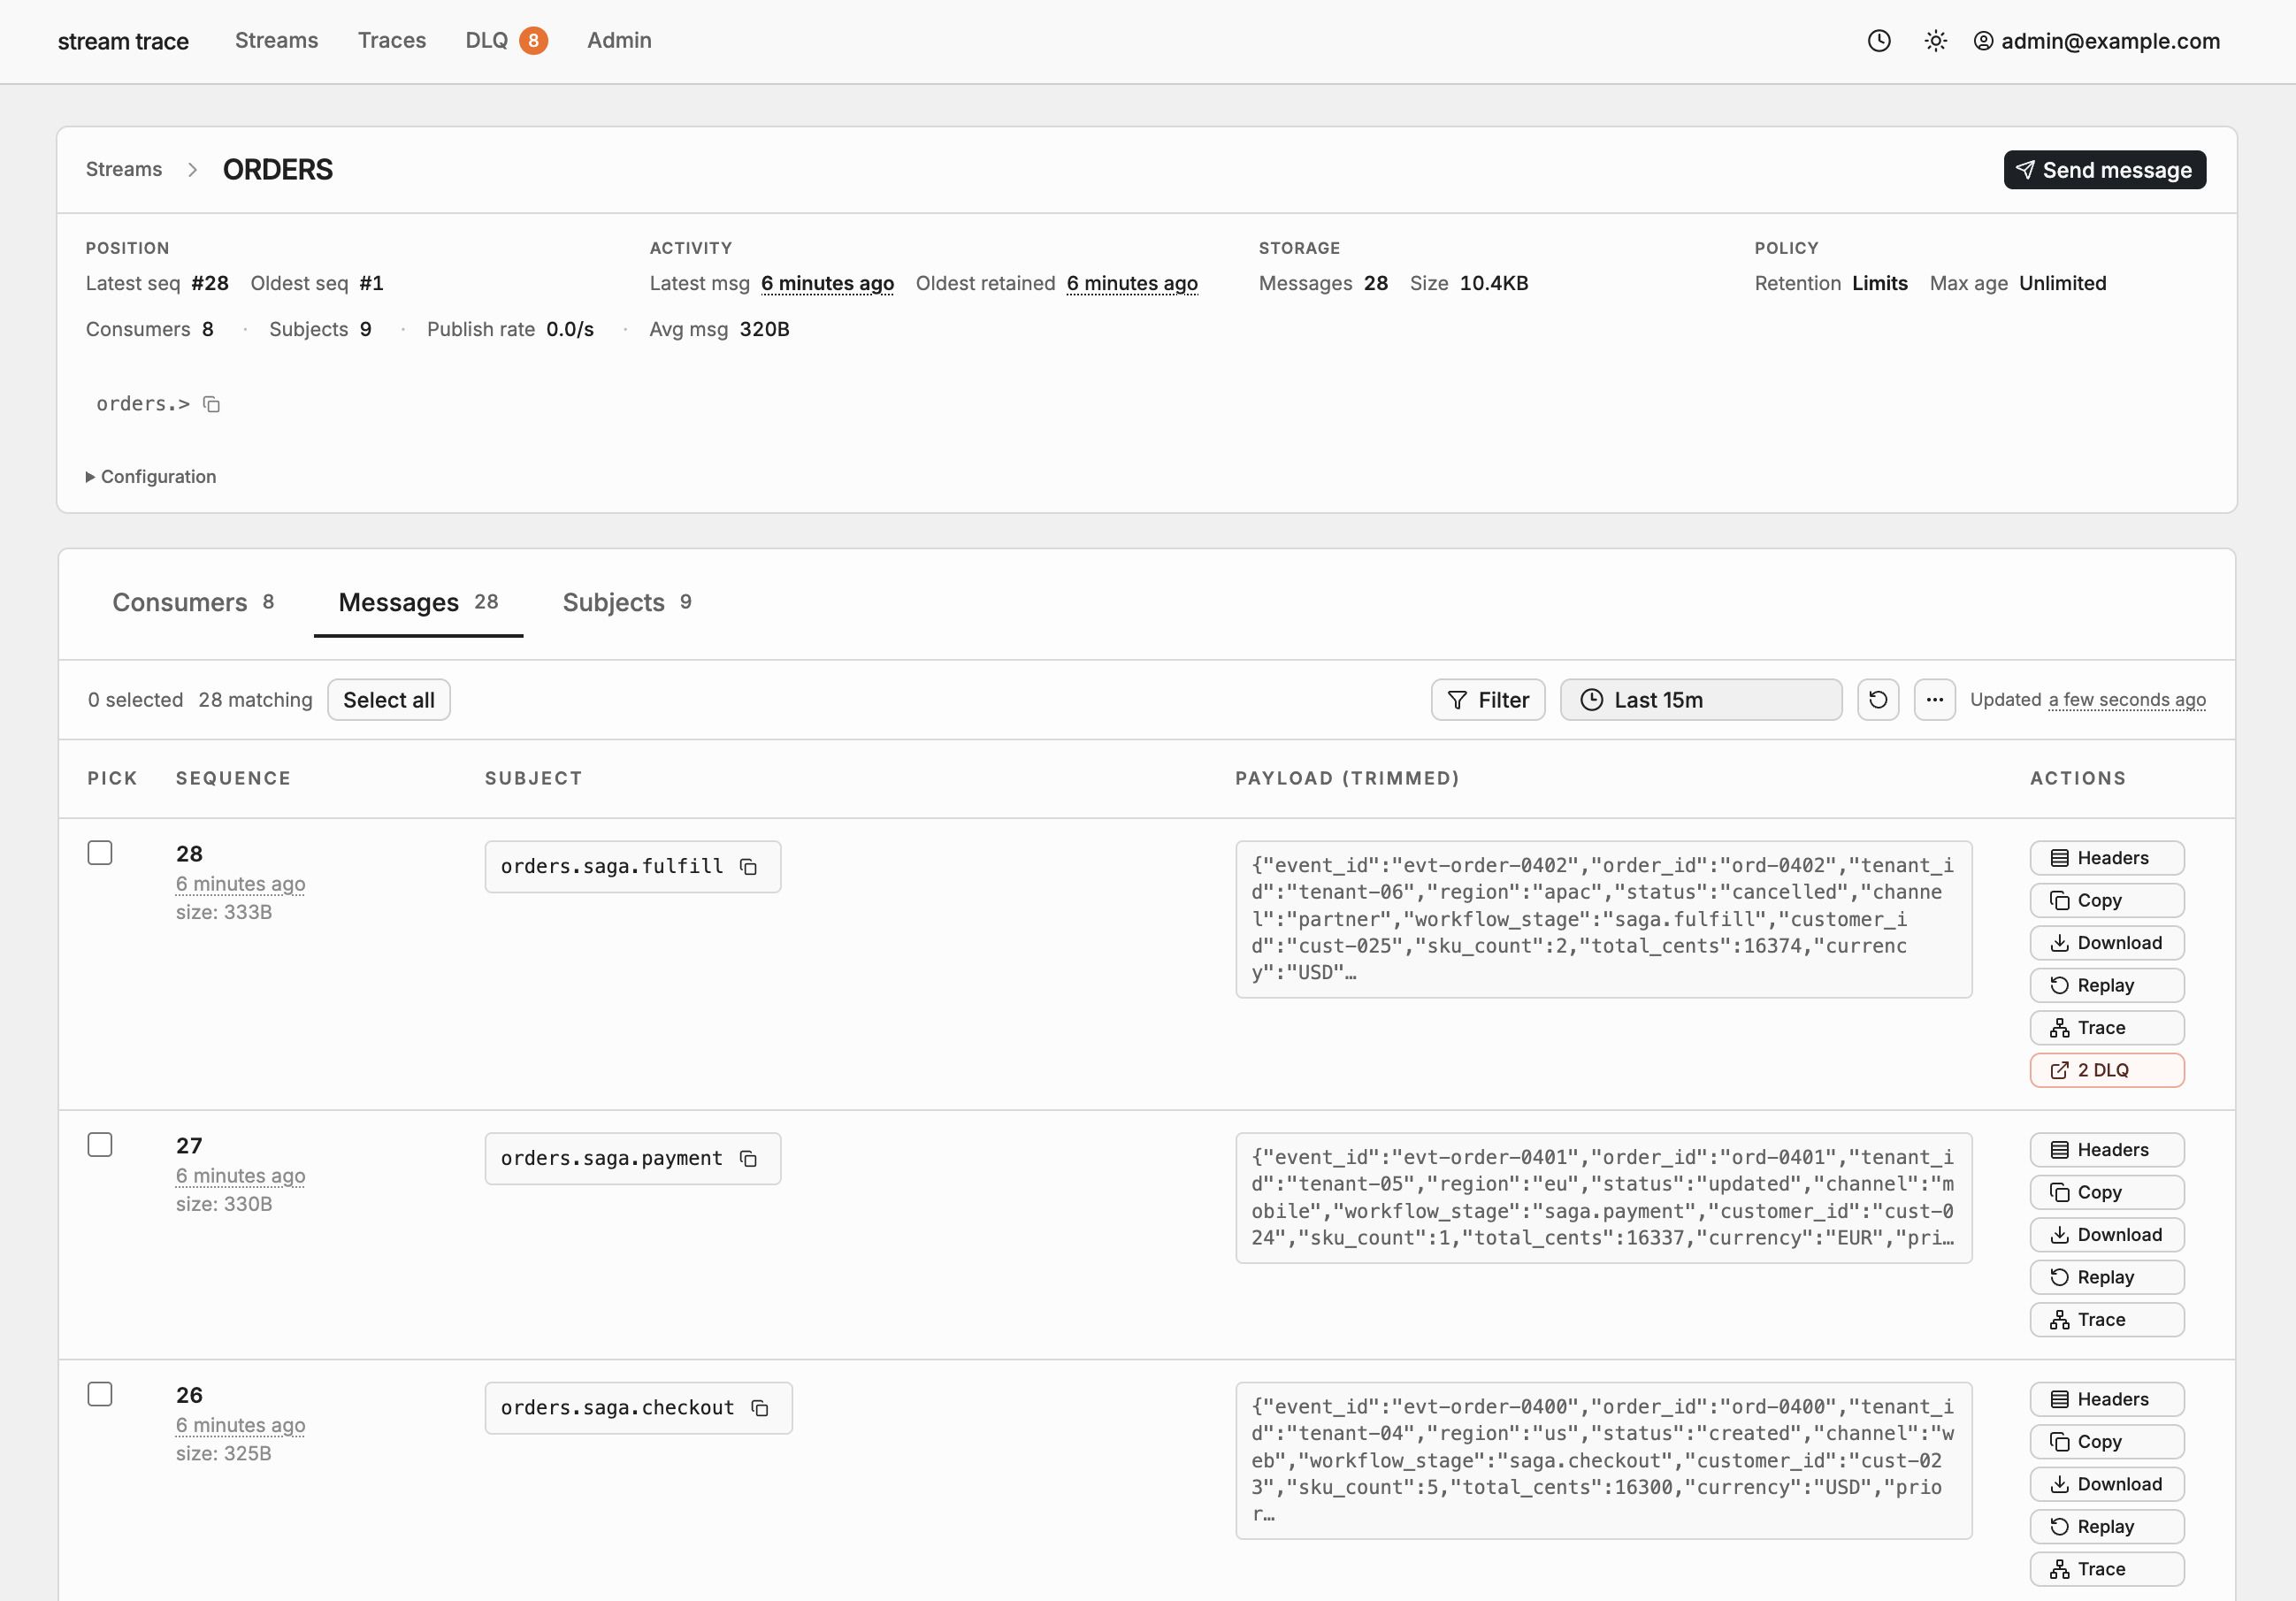
Browse and inspect messages, narrow the evidence, then preview replay or publish actions before they run.
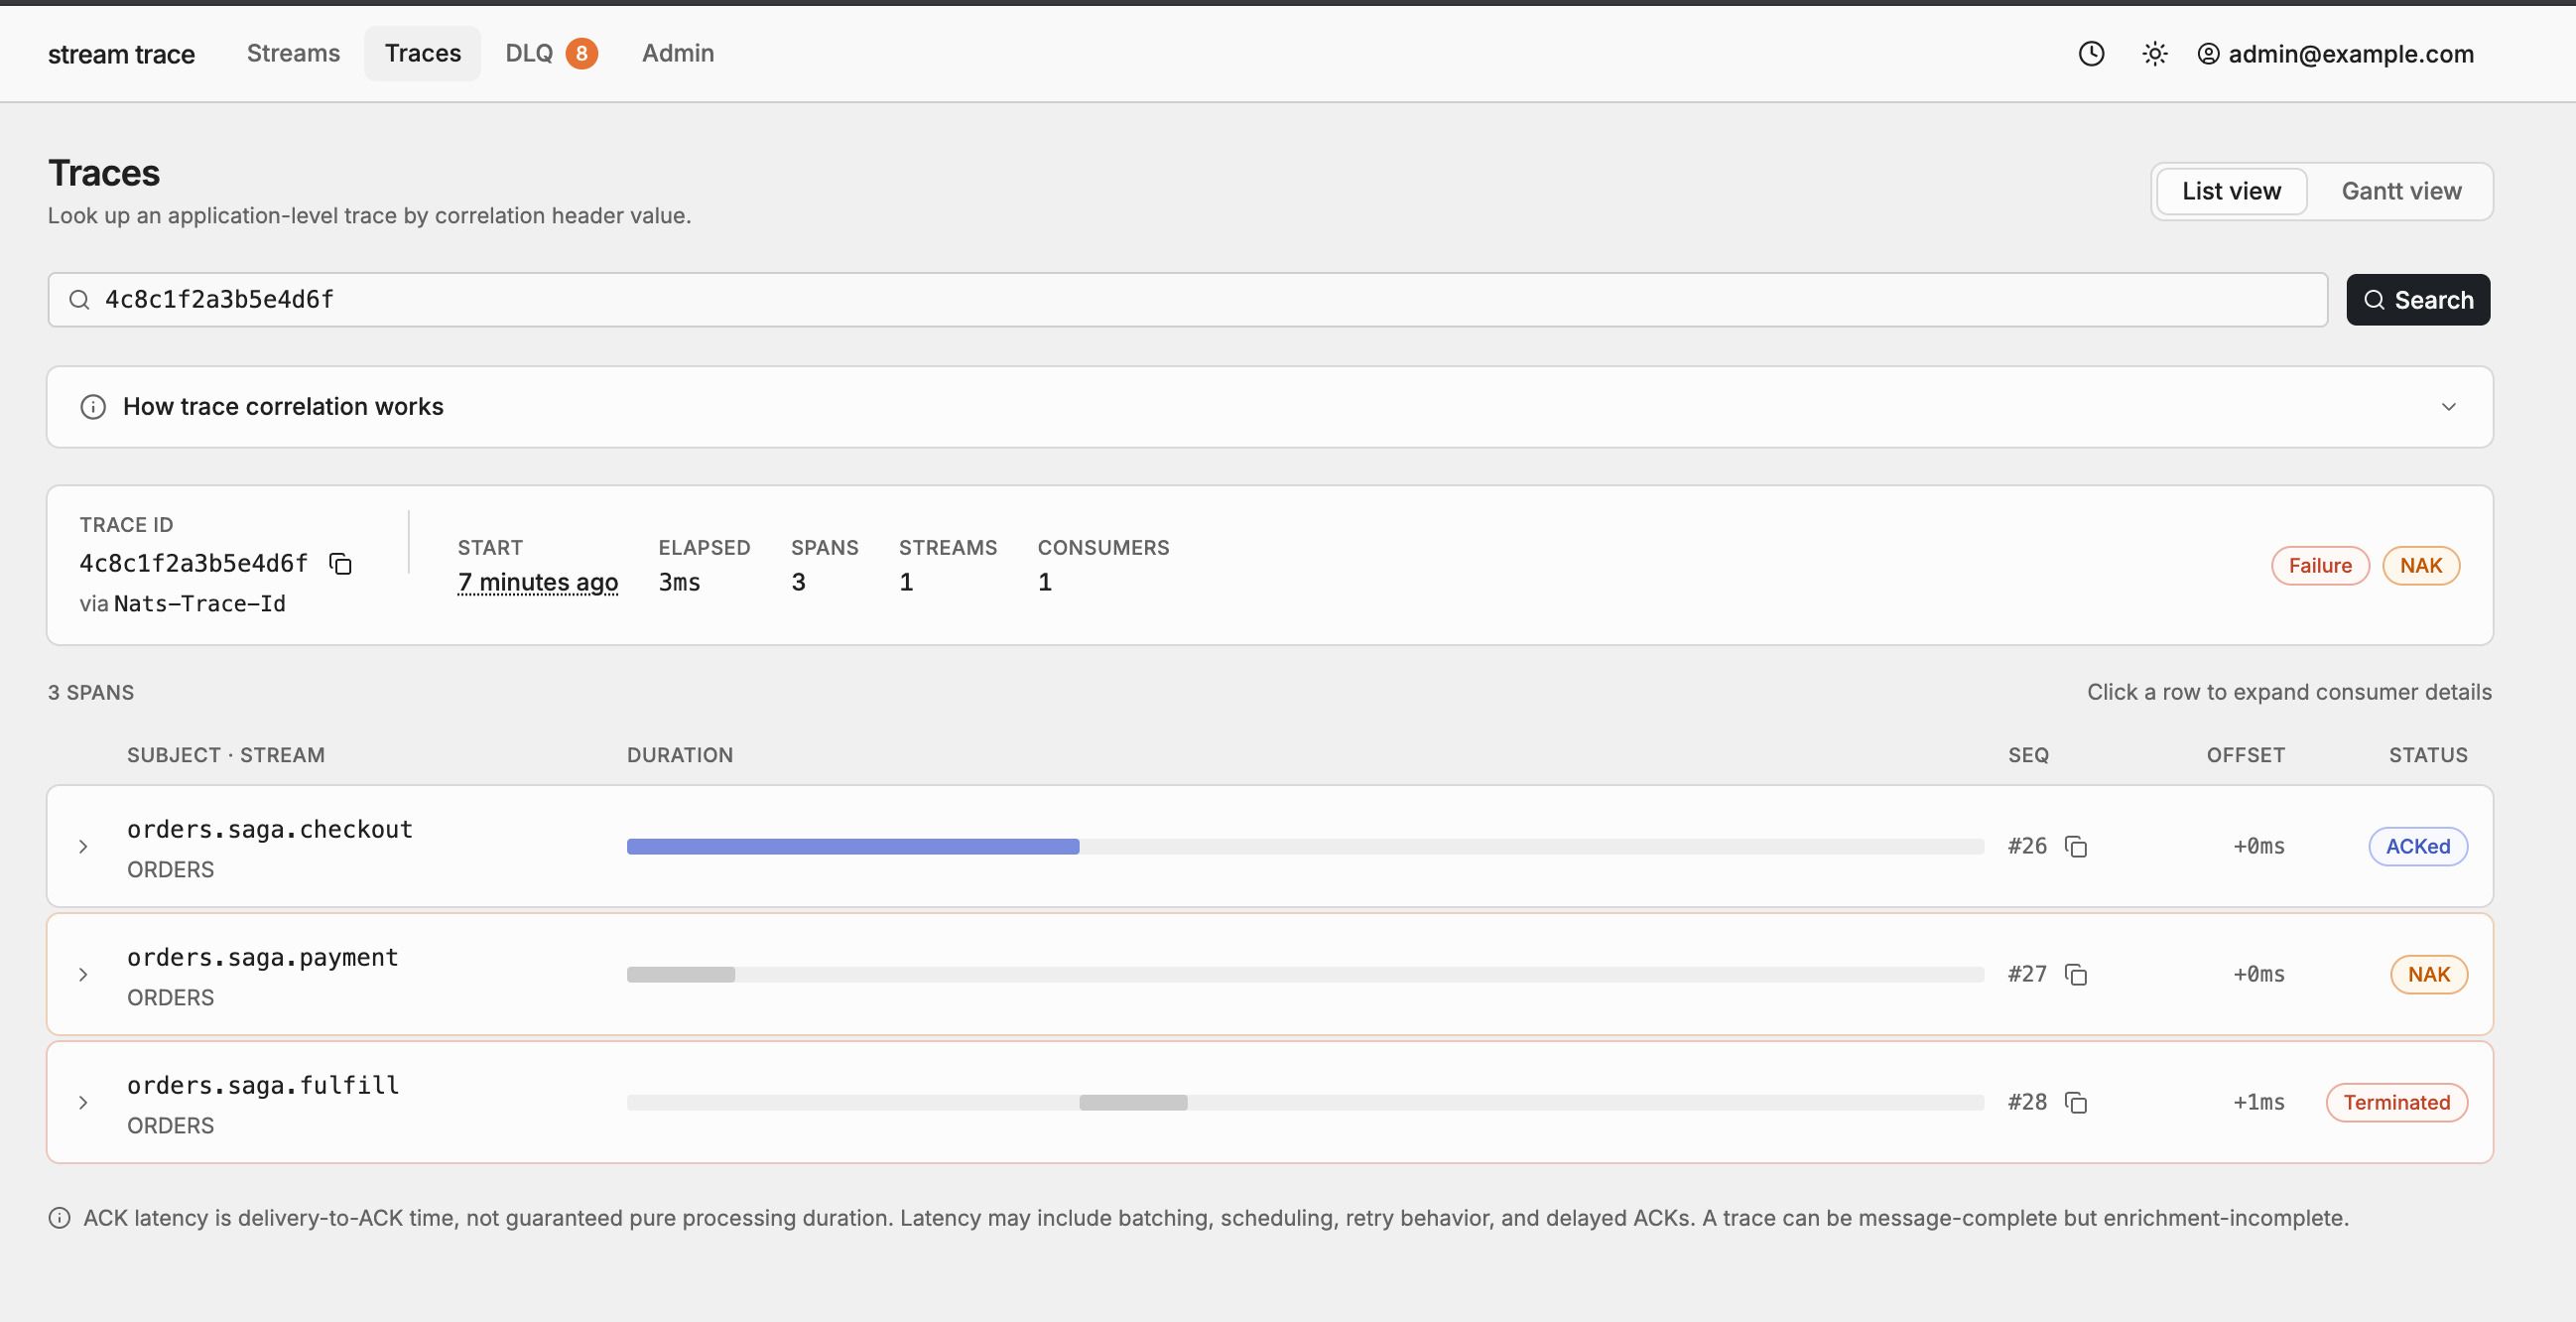
Look up a known correlation ID to follow related message occurrences across streams and consumers.
Stream Trace keeps discovery, investigation, and controlled remediation connected, so your team can understand the likely impact before changing message flow.
Use stream signals, consumer health, throughput, subject distribution, and DLQ counts to find where an investigation should begin.
Narrow messages by subject, sequence, and time. Inspect payloads and headers, or use the optional payload index and a known correlation ID for deeper analysis.
Preview replay impact, confirm publishing actions, and retry or resolve DLQ cases through permissioned workflows that record their outcomes.
Basic monitoring starts with NATS access. Tracing, DLQ cases, and targeted replay depend on explicit headers, consumer settings, and application routing that Stream Trace does not change for you.
Publishers attach and propagate one stable trace-ID header. Consumer SampleFrequency enables sampled ACK and latency details.
Application consumers use explicit ACK behavior and a finite MaxDeliver; a dedicated advisory stream captures terminal events.
Consumer metadata declares streamtrace.replay_subject, and your stream and application route that subject to the intended handler.
LimitsPolicy supports history. WorkQueue message history is unsupported, so Stream Trace detects and excludes those streams automatically.
Use OIDC or local accounts, role-based permissions, team-owned streams, and audit logs to control who can view sensitive data or perform write actions.
Log in with your existing identity provider. Connect one or more OIDC providers, or use built-in local accounts with email verification.
Fine-grained permissions for streams, DLQ, traces, and audit. Use built-in roles or define your own, scoped globally or per team.
Assign streams to teams so each team sees only what it owns. Provision teams and access automatically from OIDC group claims.
Review supported authentication, administration, publishing, replay, and DLQ action outcomes in the instance audit log. Ordinary reads and exports are not recorded.
Start with a combined container and SQLite, or use PostgreSQL when separating API and indexer roles. Step-by-step guides live in the docs.
A simple combined deployment
Run the API, indexer, embedded UI, and SQLite-backed application state from one Stream Trace container.
Scale when you need it
Run the same image in your own cluster. With PostgreSQL, API and background indexer processes can scale independently.
NATS data stays within the infrastructure and integrations you configure. Optional OIDC and SMTP connections go only to the endpoints you choose.
Run without public Internet access when authentication and email are disabled or provided by services inside your network.
Stream, consumer, message, and DLQ views refresh automatically, with explicit updated times and manual refresh when you need it.
Virtualized tables, cursor pagination, dark mode, responsive layouts, and clear loading, empty, partial, and error states.
Liveness and readiness endpoints, structured logs, NATS reconnect handling, migrations, and graceful shutdown are built in.
Browse NATS directly for freshness, or enable local subject and payload indexing for richer filtering and search.
Publishing, replay, and DLQ remediation require explicit permissions, confirmation or impact preview, and auditable outcomes.
Frequently asked questions
Stream Trace is in private beta. Request beta access to join the onboarding queue—we're inviting teams in batches and using their feedback to shape the release.
Pricing will be announced before general availability. Private-beta access is currently free for participating teams.
Stream Trace requires NATS with JetStream enabled. Because JetStream capabilities vary across NATS 2.x releases, we'll publish the tested compatibility matrix before general availability.
Yes, in documented ways. The default indexer manages a durable consumer on each eligible, non-excluded stream and ACKs indexed messages; WorkQueue streams are excluded automatically. Stream Trace also manages an advisory consumer, can optionally create or update its dedicated advisory-capture stream, and publishes new messages for authorized publish, replay, and retry actions. It has no application stream or consumer administration workflow, but its two managed-consumer names must be reserved because collisions can be updated or deleted by Stream Trace.
Yes. Stream Trace supports one or more OIDC providers, plus built-in local accounts with email verification. Teams and access can be provisioned from OIDC group claims.
Yes. Role-based permissions separately control stream metadata, sensitive payloads, publishing, replay, DLQ remediation, traces, and administration. Team ownership limits which streams members can access.
Browse and filter by subject, sequence, and time. An optional payload index adds full-text search and JSON path scalar filters such as exists, equals, not equals, and comparisons. The UI reports when indexing is disabled or still catching up.
Stream Trace turns terminal max-delivery and message-terminated advisories into cases you can inspect, retry, or resolve. You can provide the advisory stream or explicitly enable creation of Stream Trace's dedicated capture stream.
Your publishers must attach and propagate a configured trace-ID header. Enter that known correlation ID and Stream Trace finds matching messages across streams you can access. Consumer SampleFrequency enables sampled ACK and latency enrichment. It is application-level correlation, not NATS network-hop tracing or automatic topology discovery.
The private beta surfaces in-app health signals, DLQ counts, and diagnostic recommendations. Outbound notifications and integrations such as webhooks, Slack, PagerDuty, or email alerts are not currently included.
Stream Trace ships as a container for Docker Compose or Kubernetes. SQLite supports a simple combined deployment; PostgreSQL is required when API and indexer processes run separately.
Yes, when configured for it. Use local authentication with email disabled, or host identity and email services inside your network. Optional OIDC and SMTP integrations connect only to endpoints you configure.
Stream Trace is self-hosted, and NATS message data stays within the infrastructure and integrations you configure. Its instance audit log records supported authentication, administration, publishing, replay, and DLQ retry/discard outcomes with available actor, time, and outcome context. Ordinary reads and exports are not recorded; audit writes are best-effort.
We share the roadmap with beta participants and actively collect feedback. Public contribution details will be published when they are available.
Learn about NATS, observability best practices, and distributed systems.
Join the free, invite-only Stream Trace beta for non-production evaluation. Confirm your email, then wait for an invitation as we approve participants in small groups. Unsubscribe at any time.